Advanced Cycles Paper Trading Results
During every Advanced Cycles course I have provided a written proven profitable plan and demonstrated its real time implementation on the Dow. The plan is discussed Day1 and a trade direction is set with full cyclic explanation as to why. All further calls are made ahead of time for the next 6 months. There has not been, and will not be, any ‘coulda’, ‘woulda’ or ‘shoulda’ involved in the results. This is unrealistic trading in that the campaign is turned on when an Advanced Cycles course starts and turned off when the course ends. Real campaigns start for good (cyclic) reasons and end for those reasons too.
The principle based nature of cycles theory means poor results were and will continue to be, down to me. Cycle based results depend on correct understanding of many things. An accurate cyclic model and accurate phasing are at the top of the list but even world class cycle analysts make wrong calls. The losing campaigns were down to me. Having the phasing wrong and therefore having the trend wrong means results are not perfect. I reserve the right to be smarter tomorrow.
Executive Summary
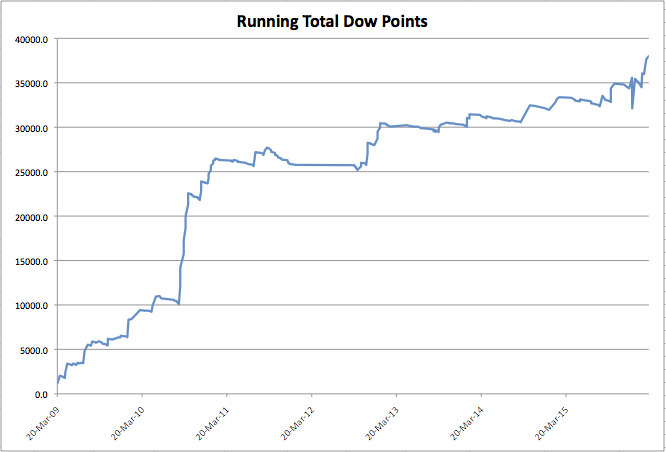
• 15 campaigns were conducted on the Dow across approximately 6 monthly periods with some overlapping campaigns starting March 2009 and ending March 2016. No course was conducted for the most part of 2012.
• Of these campaigns, 12 were profitable (Average 3436 points) and 3 were not (Average -1086 points)
• Overall there was an average profit of 2532 points per campaign. On the mini Dow this translates to 2532 x $5 = $12,660.
• 80% of campaigns were profitable (12/15)
Overall Metrics Across All Campaigns
Number of Trades |
278 |
Approximately 20 trades per campaign |
Losers |
203 |
|
Winners |
75 |
|
% Winners |
27% |
|
Ave Loss |
67.3 |
points |
Ave Profit |
647.5 |
points |
Profit Ratio |
9.6 |
Average Profit/Average Loss |
Expectancy
(Ave of R) |
1.73 |
Average of R Multiples |
Stan Dev (of R) |
6.26 |
Mathematical measure of the spread of the data about the mean |
|
|
|
Mathematical Expectancy |
1.865 |
Net Profit/(Number of Trades X Average Losing Amount) |
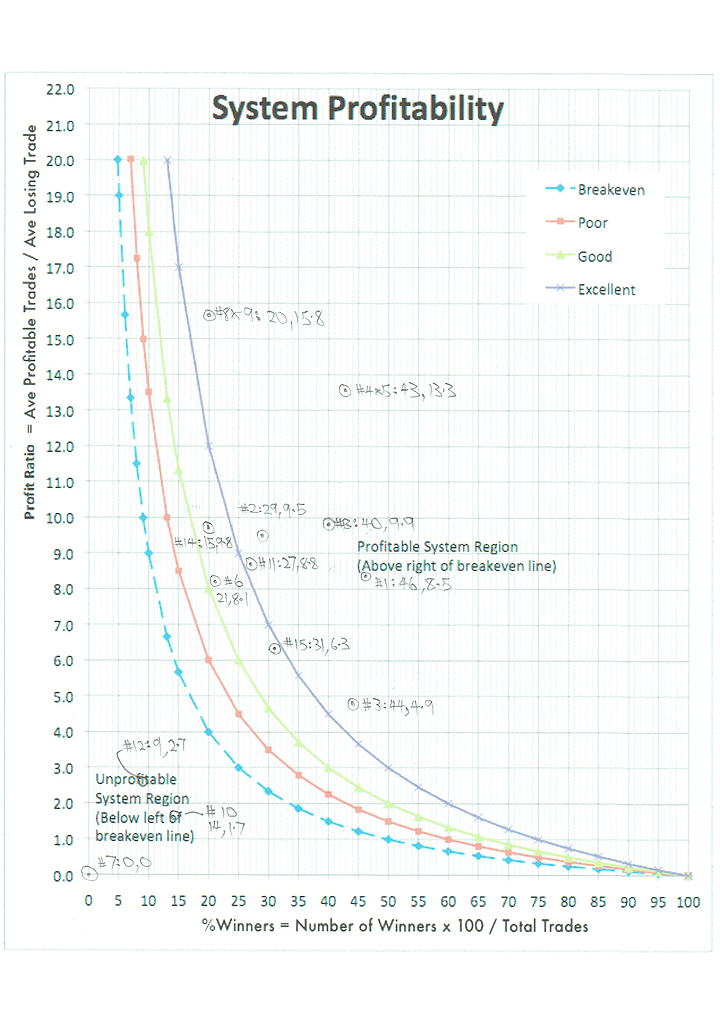
System Quality Number (SQN) |
2.76 |
Expectancy * sqrt(n) / Stan Dev(R) |
Detailed Metrics
| Course Number |
1 |
2 |
3 |
4 |
5 |
6 |
7 |
8 |
9 |
10 |
11 |
12 |
13 |
14 |
| Net Profit (Dow points) |
5902.00 |
2645.00 |
2074.64 |
7832.90 |
7832.90 |
1393.40 |
-1934.00 |
2153.40 |
2153.40 |
-434.30 |
1816.53 |
-889.00 |
2815.50 |
1522.00 |
|
|
|
|
|
|
|
|
|
|
|
|
|
|
|
| Number of Trades |
26.00 |
24.00 |
16.00 |
23.00 |
23.00 |
19.00 |
20.00 |
20.00 |
20.00 |
14.00 |
22.00 |
22.00 |
10.00 |
26.00 |
| Losers |
14.00 |
17.00 |
9.00 |
13.00 |
13.00 |
15.00 |
20.00 |
16.00 |
16.00 |
12.00 |
16.00 |
20.00 |
6.00 |
22.00 |
| Winners |
12.00 |
7.00 |
7.00 |
10.00 |
10.00 |
4.00 |
0.00 |
4.00 |
4.00 |
2.00 |
6.00 |
2.00 |
4.00 |
4.00 |
| % Winners |
46% |
29% |
44% |
43% |
43% |
21% |
0% |
20% |
20% |
14% |
27% |
9% |
40% |
15% |
| Ave Loss |
67.29 |
53.71 |
82.80 |
65.35 |
65.35 |
80.60 |
96.70 |
45.83 |
45.83 |
50.40 |
49.00 |
61.15 |
84.20 |
88.50 |
| Ave Profit |
570.33 |
508.29 |
402.83 |
868.25 |
868.25 |
650.60 |
0.00 |
721.65 |
721.65 |
85.25 |
433.43 |
167.00 |
830.18 |
867.25 |
| Profit Ratio |
8.48 |
9.46 |
4.87 |
13.29 |
13.29 |
8.07 |
0.00 |
15.75 |
15.75 |
1.69 |
8.84 |
2.73 |
9.86 |
9.80 |
| Expectancy (Ave of R) |
2.30 |
1.40 |
1.49 |
5.77 |
5.77 |
0.66 |
-1.00 |
1.97 |
1.97 |
-0.64 |
1.10 |
-0.68 |
1.67 |
0.29 |
| Stan Dev (of R) |
4.75 |
6.97 |
3.82 |
10.52 |
10.52 |
4.38 |
0.00 |
6.64 |
6.64 |
0.85 |
4.26 |
0.97 |
3.63 |
3.86 |
|
|
|
|
|
|
|
|
|
|
|
|
|
|
|
| Mathematical Expectancy |
3.37 |
2.05 |
1.57 |
5.21 |
5.21 |
0.91 |
-1.00 |
2.35 |
2.35 |
-0.62 |
1.68 |
-0.66 |
3.34 |
0.66 |
|
|
|
|
|
|
|
|
|
|
|
|
|
|
|
| Course Number |
15 |
16 |
17 |
18 |
19 |
20 |
21 |
22 |
23 |
24 |
AVERAGE* |
|
| Net Profit (Dow points) |
3093 |
|
|
|
|
|
|
|
|
|
2531.82 |
points |
|
|
|
|
|
|
|
|
|
|
|
|
|
| Number of Trades |
16.00 |
|
|
|
|
|
|
|
|
|
20.07 |
|
| Losers |
11.00 |
|
|
|
|
|
|
|
|
|
14.67 |
|
| Winners |
5.00 |
|
|
|
|
|
|
|
|
|
5.40 |
|
| % Winners |
31% |
|
|
|
|
|
|
|
|
|
27% |
|
| Ave Loss |
151.45 |
|
|
|
|
|
|
|
|
|
72.54 |
points |
| Ave Profit |
951.80 |
|
|
|
|
|
|
|
|
|
576.45 |
points |
| Profit Ratio |
6.28 |
|
|
|
|
|
|
|
|
|
8.54 |
Average Profit/Average Loss |
| Expectancy (Ave of R) |
2.22 |
|
|
|
|
|
|
|
|
|
1.62 |
Average of R Multiples |
| Stan Dev (of R) |
4.56 |
|
|
|
|
|
|
|
|
|
4.82 |
Mathematical measure of the spread about the mean |
|
|
|
|
|
|
|
|
|
|
|
|
|
| Mathematical Expectancy |
1.28 |
|
|
|
|
|
|
|
|
|
1.85 |
Net Profit/(Number of Trades X Average Losing Amount) |
|
|
|
|
|
|
|
|
|
|
|
*Averaging averages is problematic |
Thank you to participants who lived these courses and who provided constructive criticism and feedback.
Ref: AC160329Paper Tading Results A01C-A15C.xlsx
Ref: FM A1-15C Advanced Cycles Paper Trading Results.docx
Ref: System profitability via MASTER AC folder
